TL;DR
- Most call reporting starts counting when someone picks up. The calls that cost the most never get that far.
- Pull answer rate from your carrier record, not your queue software. Expect a 10 to 20 point gap.
- Fifteen metrics, four questions: did we pick up, did we help, did it pay, is it getting better.
- FCR averages 70%. World class is 80%+ and about 5% of centres reach it. Measure it by survey, not by agent tick box.
- Callback speed matters more than people think. Inside an hour, 7x more likely to win the lead. Nearly a quarter of companies never call back.
- Put revenue per call next to your after-hours share and you can price a missed call. That's the number that gets the budget.
- When an AI answers, the availability metrics go flat and everything else becomes measurable for the first time.
The dashboard at a three-location dental group was green across the board. CSAT at 4.6. Average handle time under four minutes. First call resolution at 78%, comfortably above the industry average. The practice manager had it on a screen in the back office and pointed to it whenever anyone asked how the phones were doing.
Then the marketing agency ran a call tracking report for the first time and found that 31% of calls arriving between 12:00 and 13:30 on weekdays never reached a person. They rang out to voicemail while the front desk was at lunch. Nobody had lied. The dashboard measured the calls that were answered, and measured them well. The most expensive number in the building was the one that never showed up in a report.
That is the trap with inbound call analytics. The metrics pre-built into most call center reporting start the clock at "answered," and the inbound calls that cost you the most never get that far. So this guide is organised around four plainer questions than any vendor dashboard asks: did we pick up, did we help, did it pay, and is it getting better. Fifteen metrics answer them, with the formula, a benchmark where an honest one exists, and a note on where each number tends to lie.
What is inbound call analytics, and how is it different from call tracking?
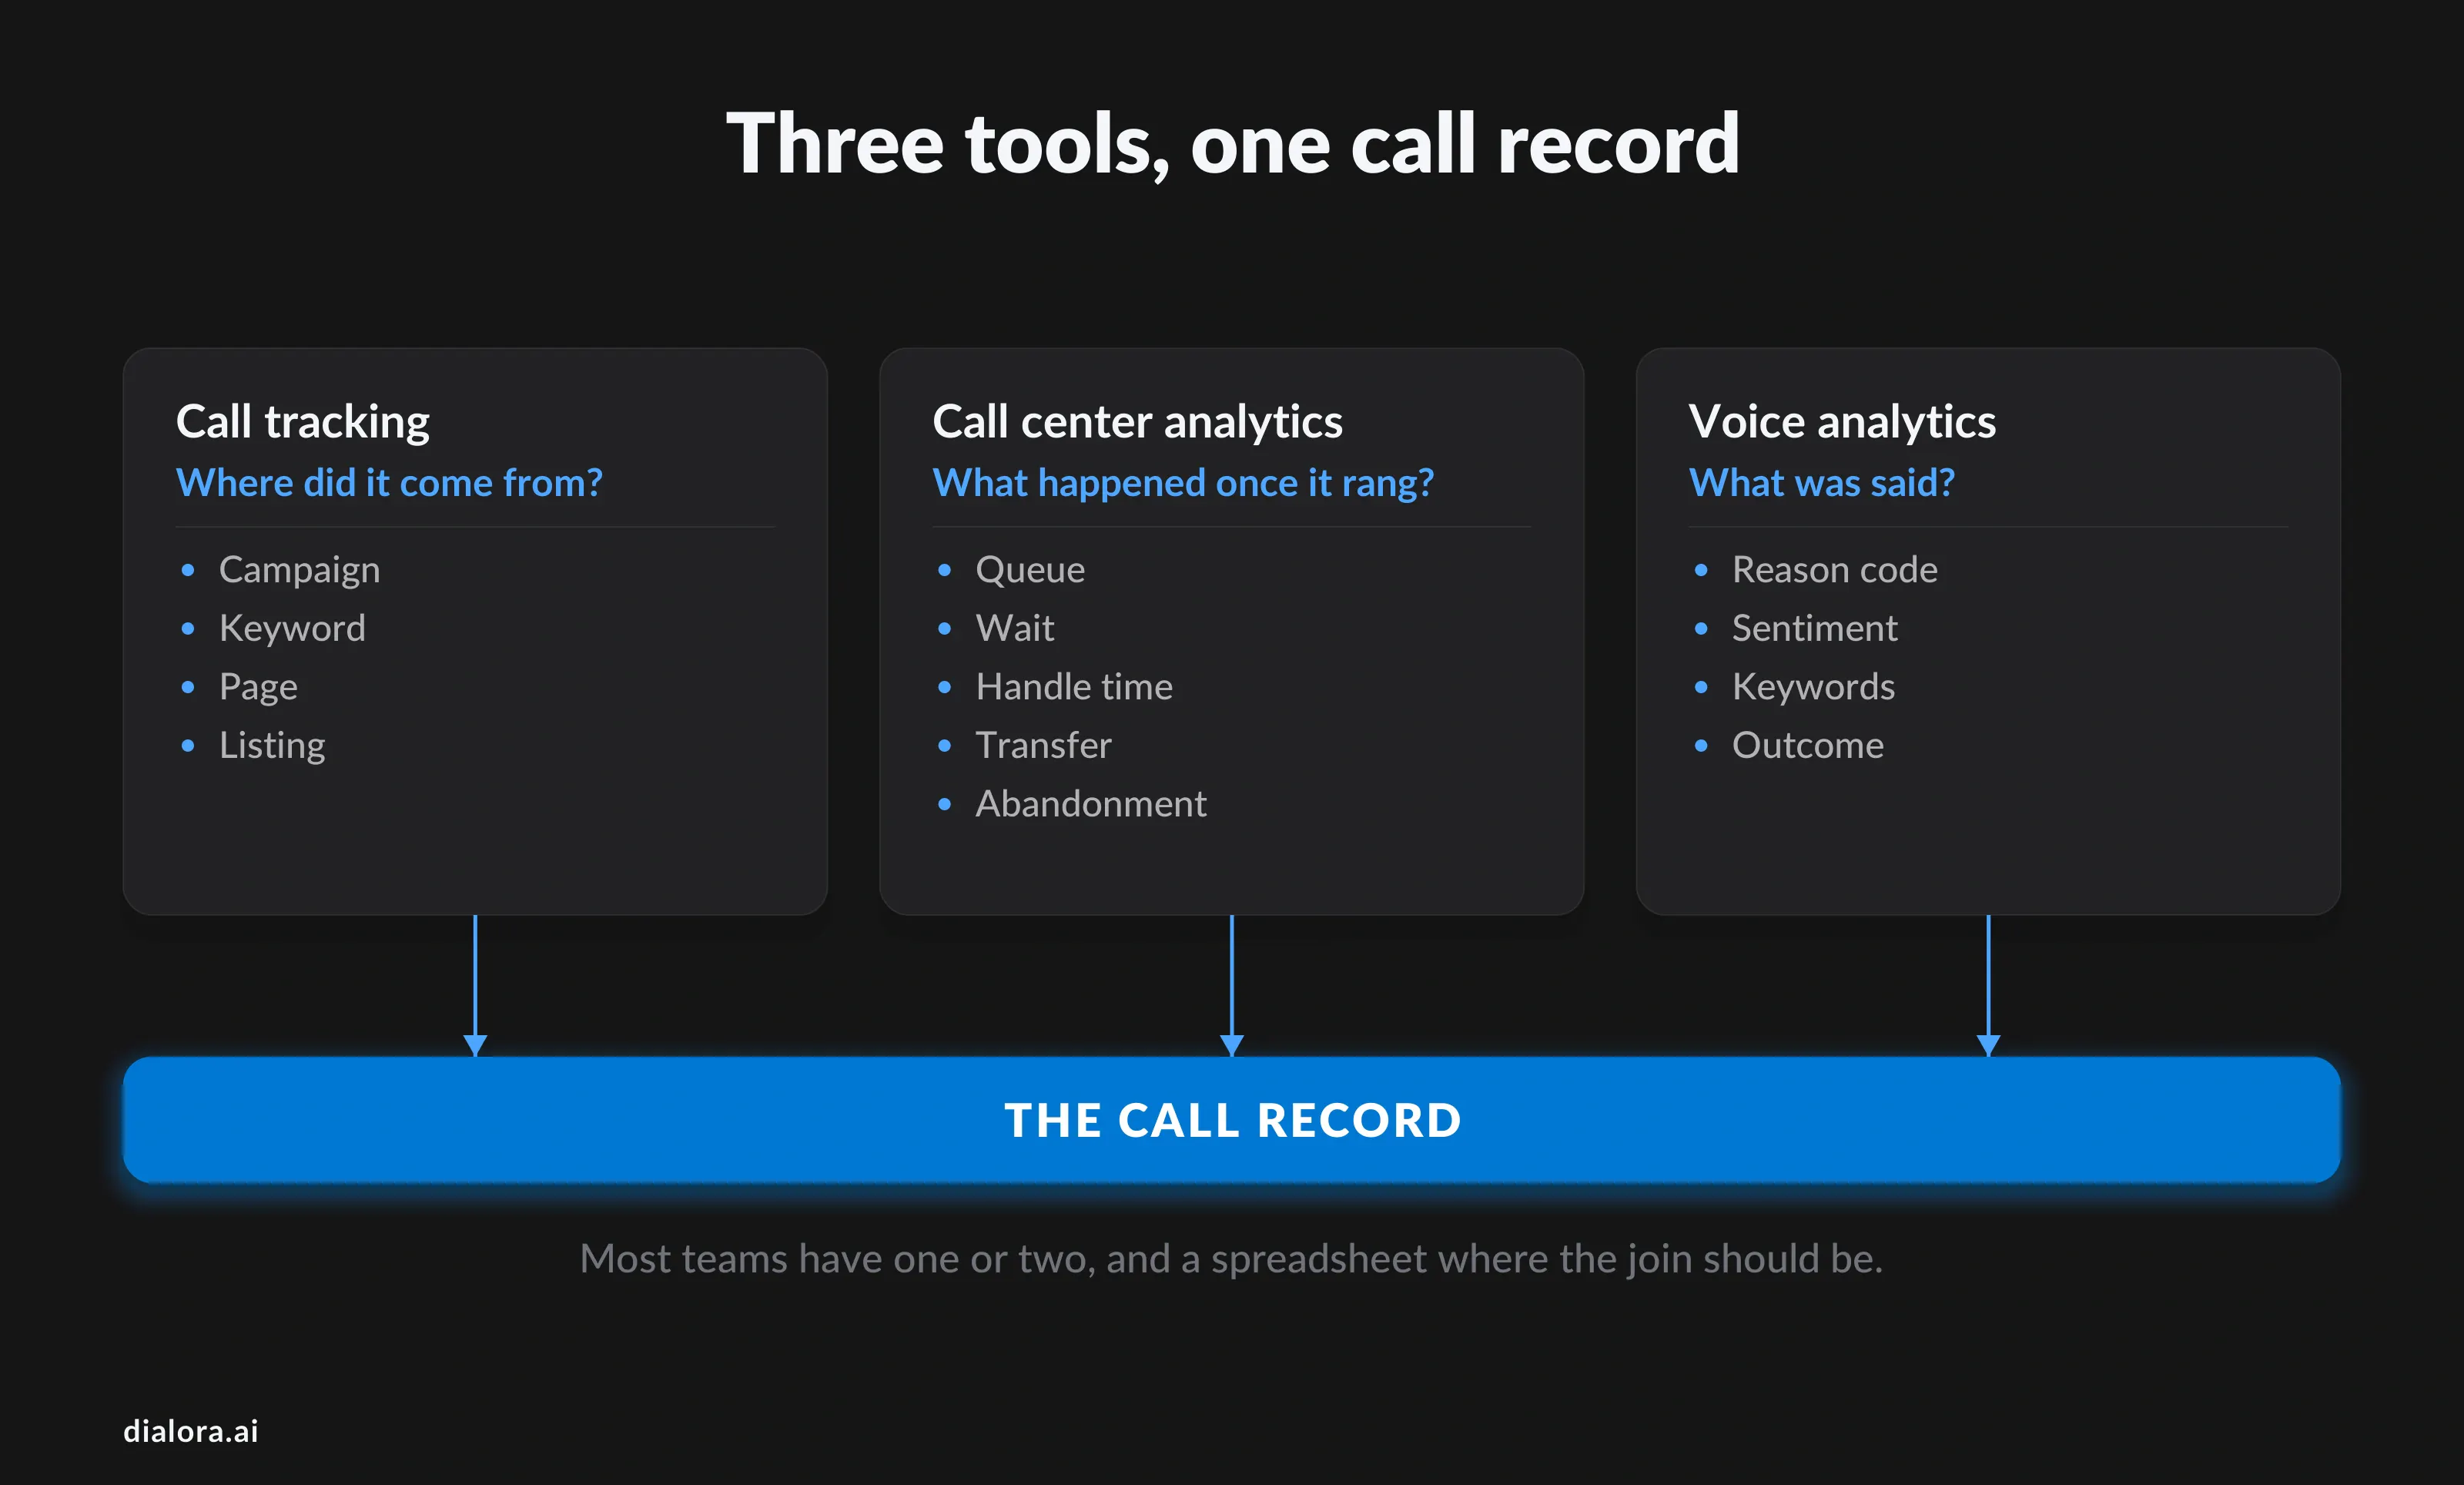
If you searched for inbound call meaning, the answer is one line: a call the customer starts. Inbound call analytics is the measurement of what happens to those calls, from the ring to the outcome in your CRM. The catch is that three different products wear that label, and most teams buy one and assume it does the job of all three.
Call tracking software answers "where did this call come from?"
Call tracking is a marketing tool. It assigns tracking numbers to campaigns, pages or ad keywords, swaps them in when a visitor lands, and ties each call to its source. Good call tracking services will tell you Tuesday's 40 calls came from Google Ads, the Business Profile listing and a billboard number, in that order. They will not tell you how long anyone waited.
Call center analytics answers "what happened once it rang?"
Contact center analytics is the operations tool: queues, agents, wait times, handle times, transfers, abandonment. This is what most people mean by call metrics, and what call center analytics software has reported since the 1990s. It measures the calls that reached the queue well and is blind to the ones that did not.
Voice analytics answers "what was actually said?"
Call center voice analytics transcribes conversations and tags them: reason for calling, sentiment, keywords, whether the customer said "cancel." It is the newest of the three and the one that turns a pile of recordings into a list of your top twenty call reasons.
Inbound call tracking and analytics done properly are all three joined at the call record. Most businesses have one, sometimes two, and a spreadsheet where the join should be.
Which inbound call metrics should you track first?
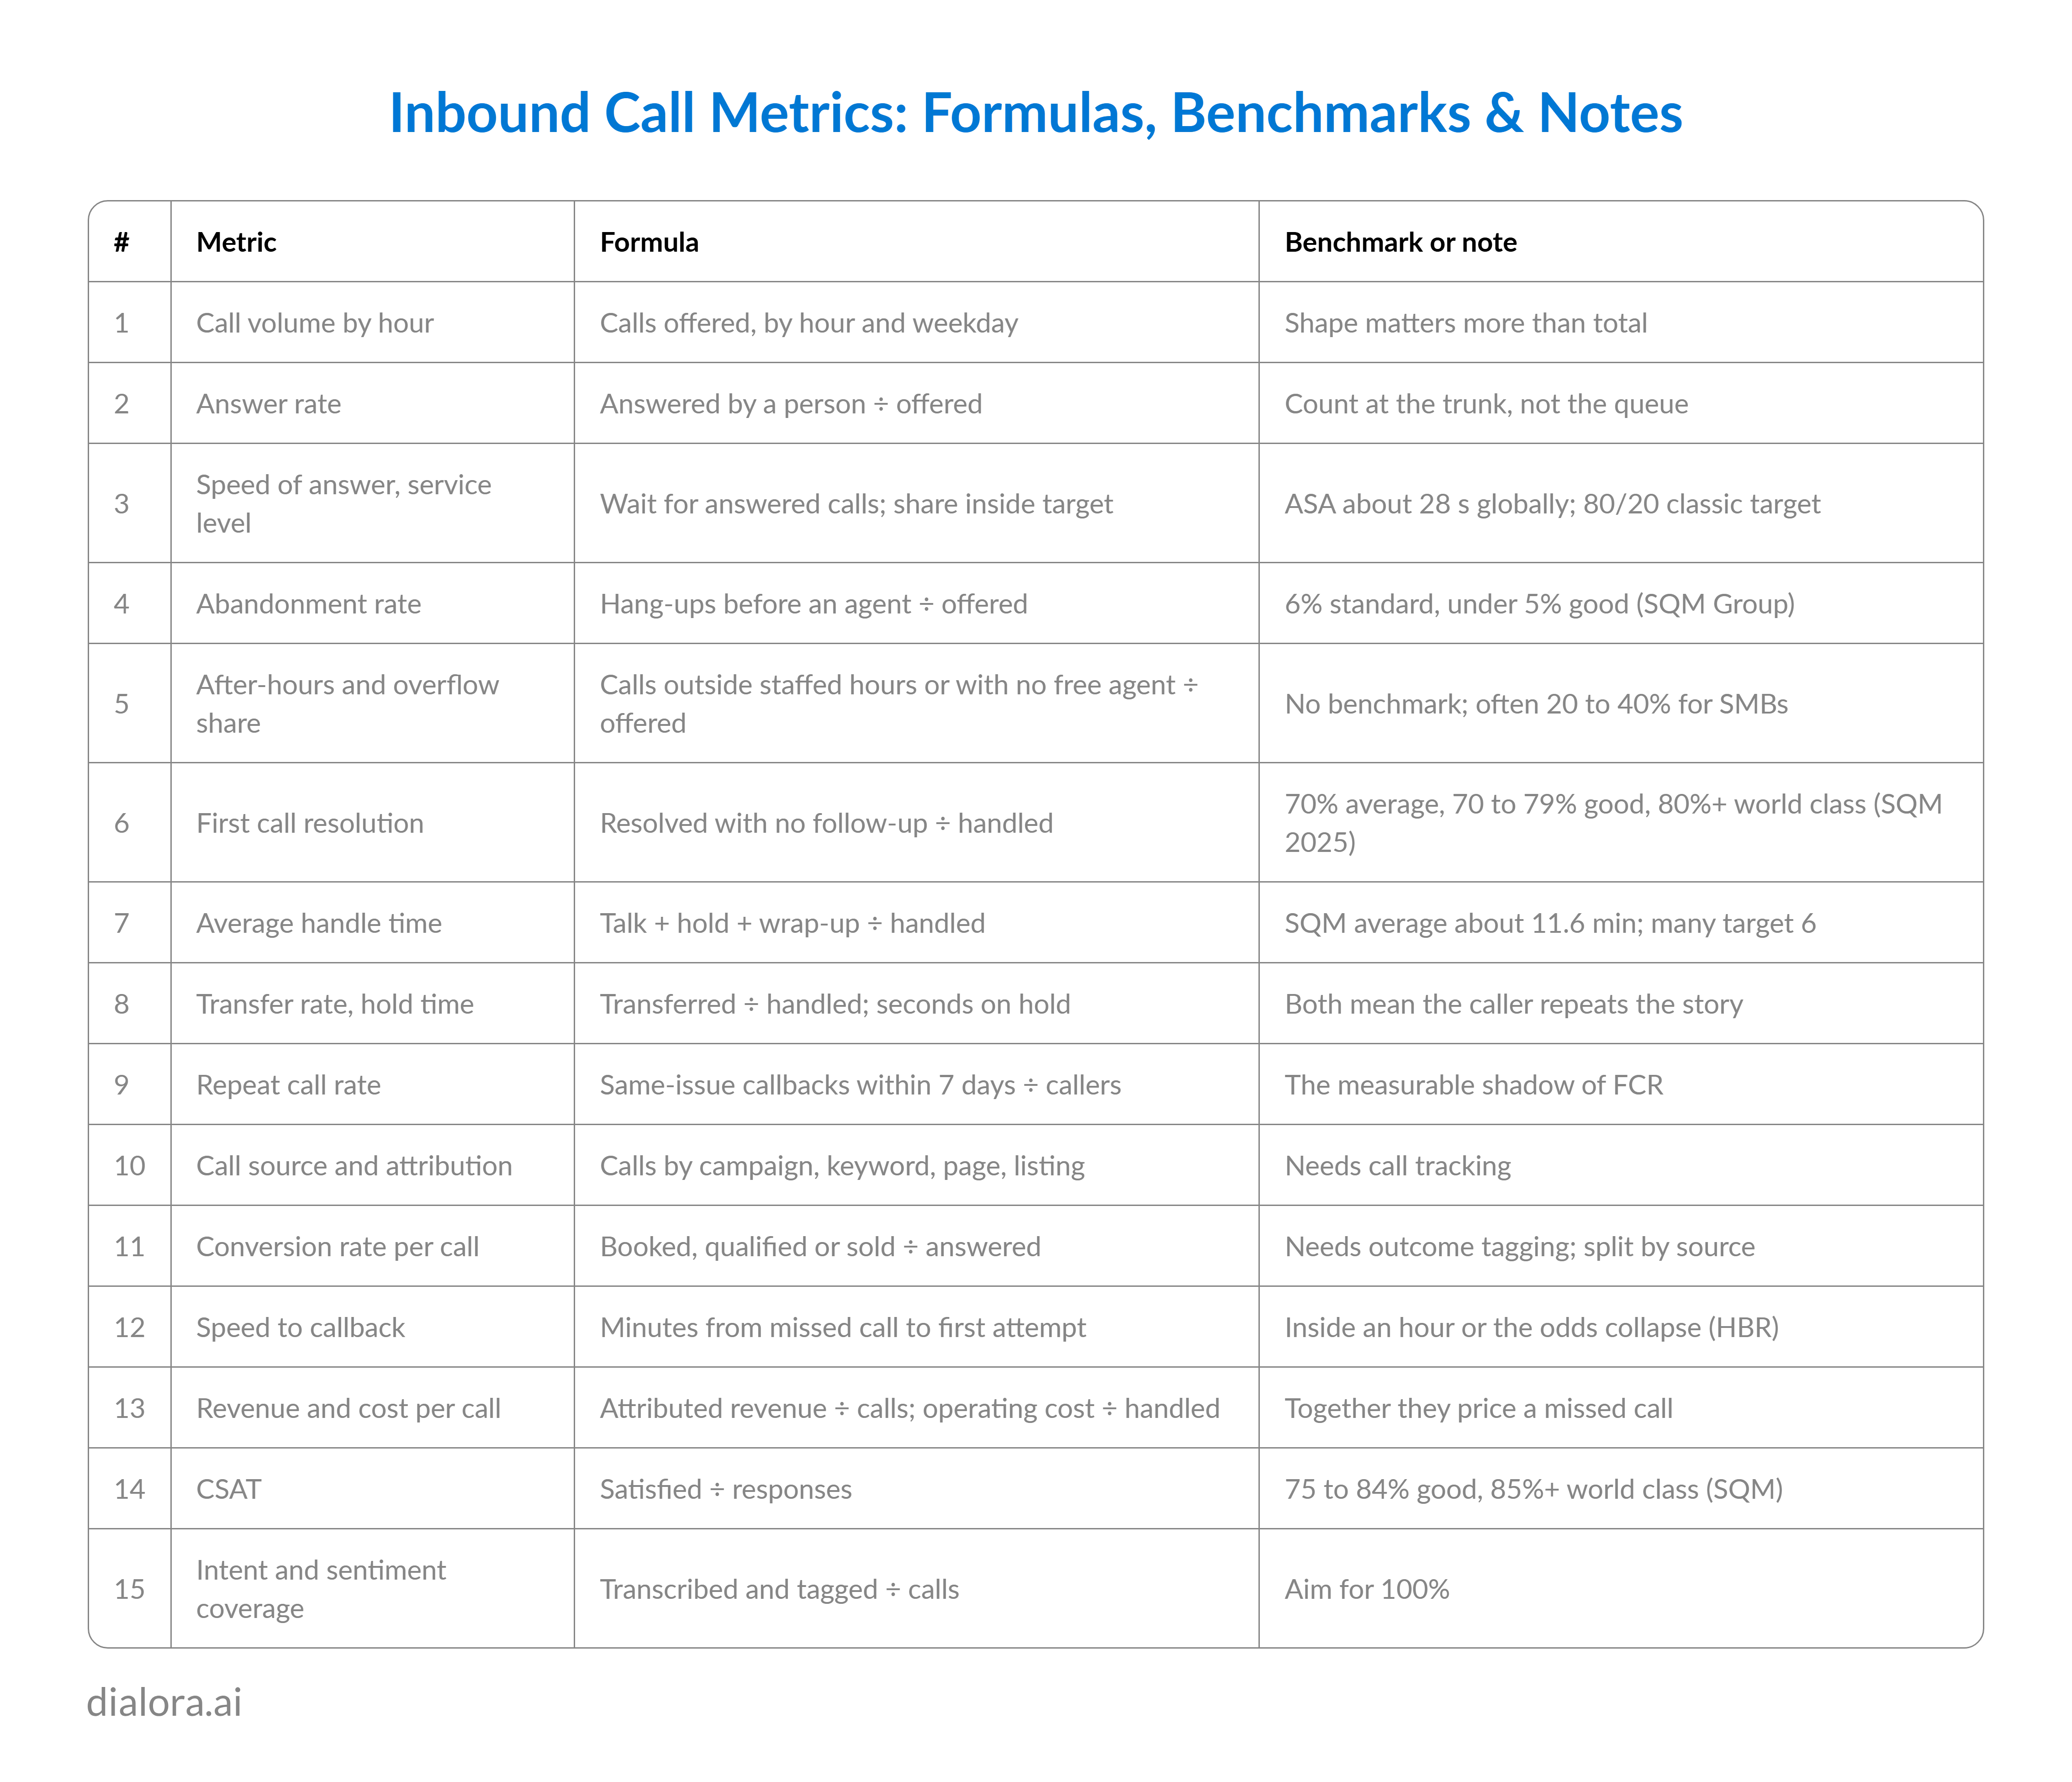
The fifteen below, grouped by the question each one answers. If you can only build four numbers this quarter, take the first metric from each group.
Did we pick up?
- 1. Inbound call volume by hour and weekday. Not the monthly total, which hides everything. The hourly shape tells you when to staff and when calls pile up; most small businesses find two peaks they never planned for, at opening and at lunch. It is also the input to any predictive analytics inbound call center forecasting. You cannot predict next Tuesday without last Tuesday.
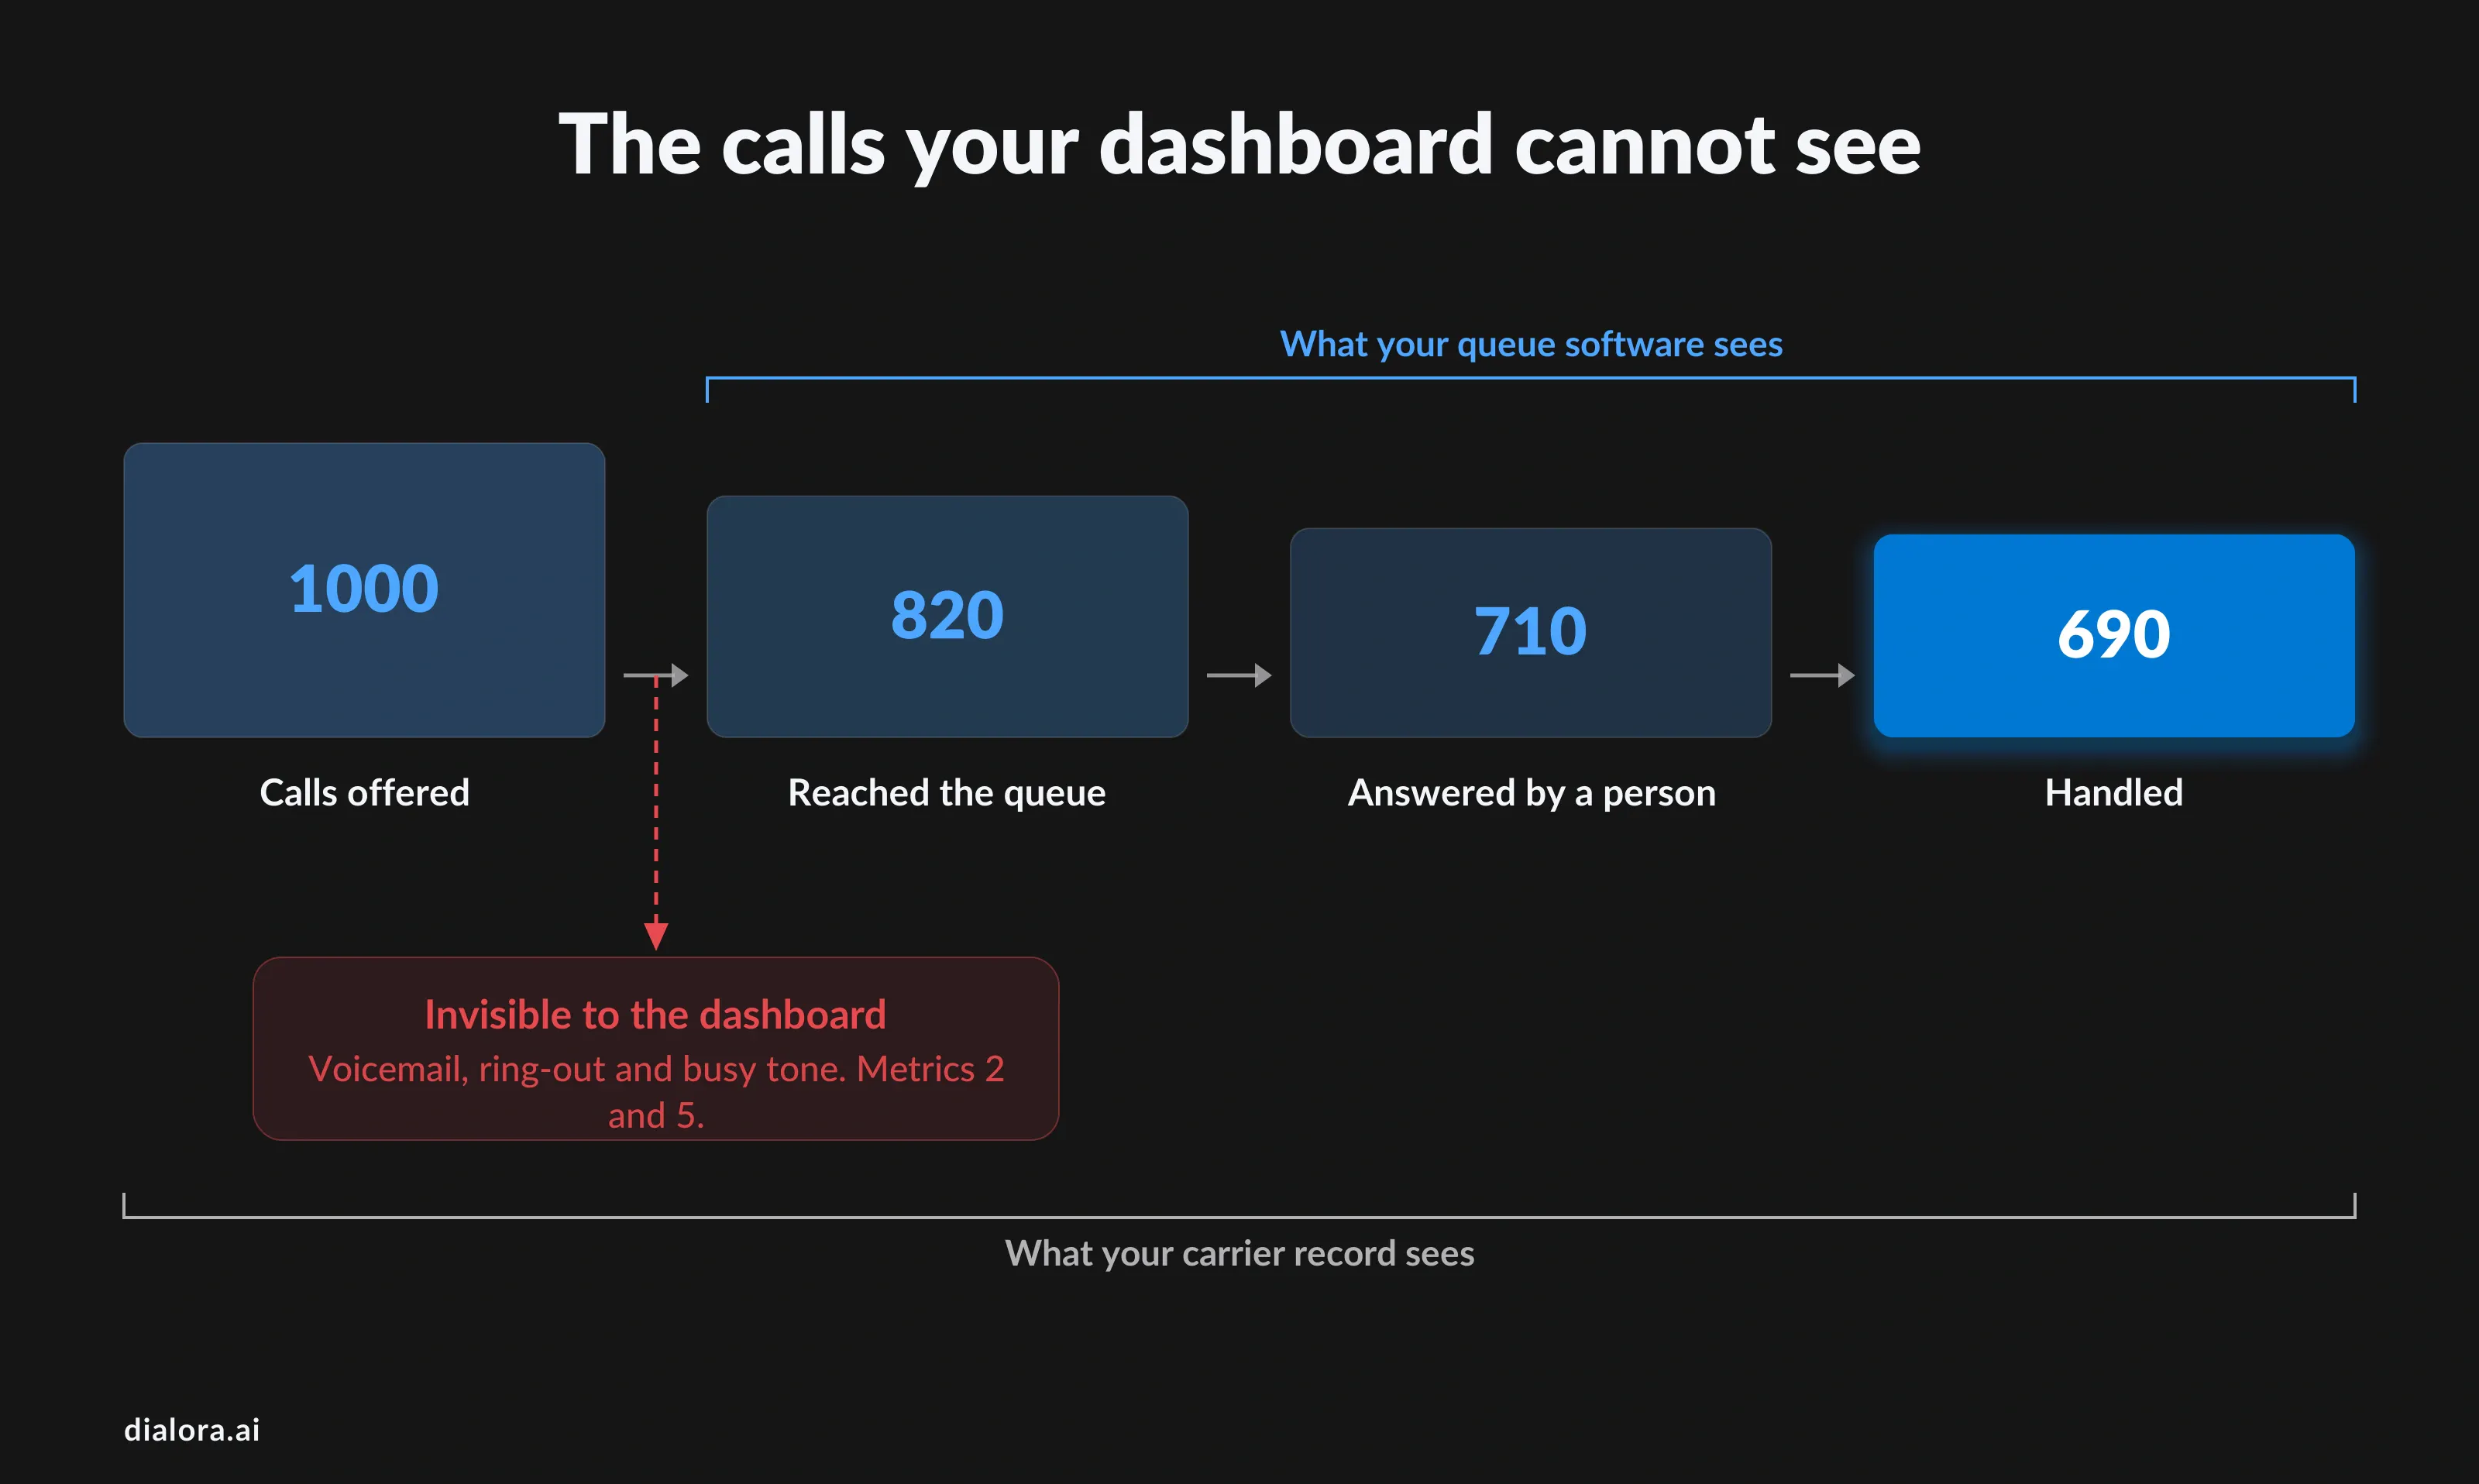
- 2. Answer rate, and its inverse, missed-call rate. Calls answered by a human divided by calls offered. The trick is where you count from. Queue reporting only sees calls that reached the queue; calls that hit voicemail, rang out or got a busy tone never enter it. Pull this from the trunk or carrier record and the number is usually 10 to 20 points worse than the dashboard says.
- 3. Average speed of answer and service level. How long the callers waited, and what shares were answered inside a target, usually 80% within 20 seconds. Set it per queue; a sales line and a billing line should not share a service level.
- 4. Abandonment rate. Callers who gave up before reaching a person. SQM Group's benchmark puts the industry standard at 6% and under 5% as good. Exclude abandons under five seconds, which are misdials, and read it next to speed of answer, because one usually explains the other.
- 5. After-hours and overflow share. The proportion of calls arriving when nobody can take them, outside staffed hours or with every agent busy. Almost nobody reports it because the phone system did exactly what it was told. Count it once and it reframes the rest of the dashboard.
Did we help?
- 6. First call resolution. The metric SQM Group calls the most important of all, and the one with a real benchmark: 70% cross-industry average in its 2025 study, 70 to 79% good, 80% and above world-class, which about 5% of centres reach. Measure it with a post-call survey, not an agent tick box; agents over-report resolution.
- 7. Average handle time. Talk plus hold plus wrap-up. SQM's measured average is about 11.6 minutes across the industries it benchmarks, though many operations target six or less. Never manage AHT down alone; the fastest way to shorten calls is to stop resolving them, and FCR pays for it a week later.
- 8. Transfer rate and hold time. Every transfer is a moment where the caller may repeat the story. Track how often it happens and how long people sit on hold, and pair it with repeat calls. Our conversational AI statistics guide covers why the handoff is where most experiences break.
- 9. Repeat call rate. Callers who ring again about the same issue inside seven days. It needs no survey, only a customer identifier and a reason code, and it is the honest floor under a flattering FCR.
Did it pay?
- 10. Call source and attribution. Which campaign, page, keyword or listing produced the call. This is call tracking software's job, and the only way to stop crediting every phone lead to "word of mouth."
- 11. Conversion rate per call. Calls that ended in a booking, a qualified lead or a sale, divided by calls answered. Someone has to tag the outcome, which is why sales call tracking software increasingly does it from the transcript. Split it by source; a Google Ads call and a Business Profile call rarely convert at the same rate.
- 12. Speed to callback. How fast someone calls back a missed call or voicemail. The Harvard Business Review audit of 2,241 US companies found firms that responded within an hour were about seven times more likely to qualify the lead than those that waited even an hour longer, and 23% never responded at all. That study is from 2011. Later audits keep finding the same shape.
- 13. Revenue per call and cost per call. Attributed revenue divided by calls answered, and operating cost divided by calls handled. Together they price the calls in metric 5. A clinic averaging $180 per answered call and missing 30% of lunchtime calls does not need a consultant to see the problem.
Is it getting better?
- 14. CSAT and post-call score. SQM Group's benchmark for a good call centre CSAT is 75 to 84%, with 85% and above world class. It moves almost one-for-one with FCR, so if you can survey only one thing, ask whether the issue was resolved.
- 15. Intent and sentiment coverage. The share of calls transcribed and tagged with a reason code and a sentiment. Voice analytics makes this automatic; without it, coverage is whatever agents typed in the notes field. Aim for 100%, because this list decides which call reasons to automate, which to script and which to escalate.
How do analytics attribute revenue to inbound phone calls?
By giving each visitor a different phone number. Call attribution from inbound phone calls works through dynamic number insertion: the call tracking system holds a pool of numbers, swaps one into your website for each visitor session, and records which campaign, keyword or page that session came from. When the call arrives on that number, the source is known. Offline sources get static numbers of their own: one for the billboard, one for the mailer, one for the Business Profile listing.
That proves the source. It does not prove the money. Revenue lives in your CRM or practice management system, and the join is the outcome tag on the call: booked, quoted, closed, value. Most call tracking software pushes the call into the CRM as an activity; whether anyone closes the loop with a value is a discipline problem rather than a software one.
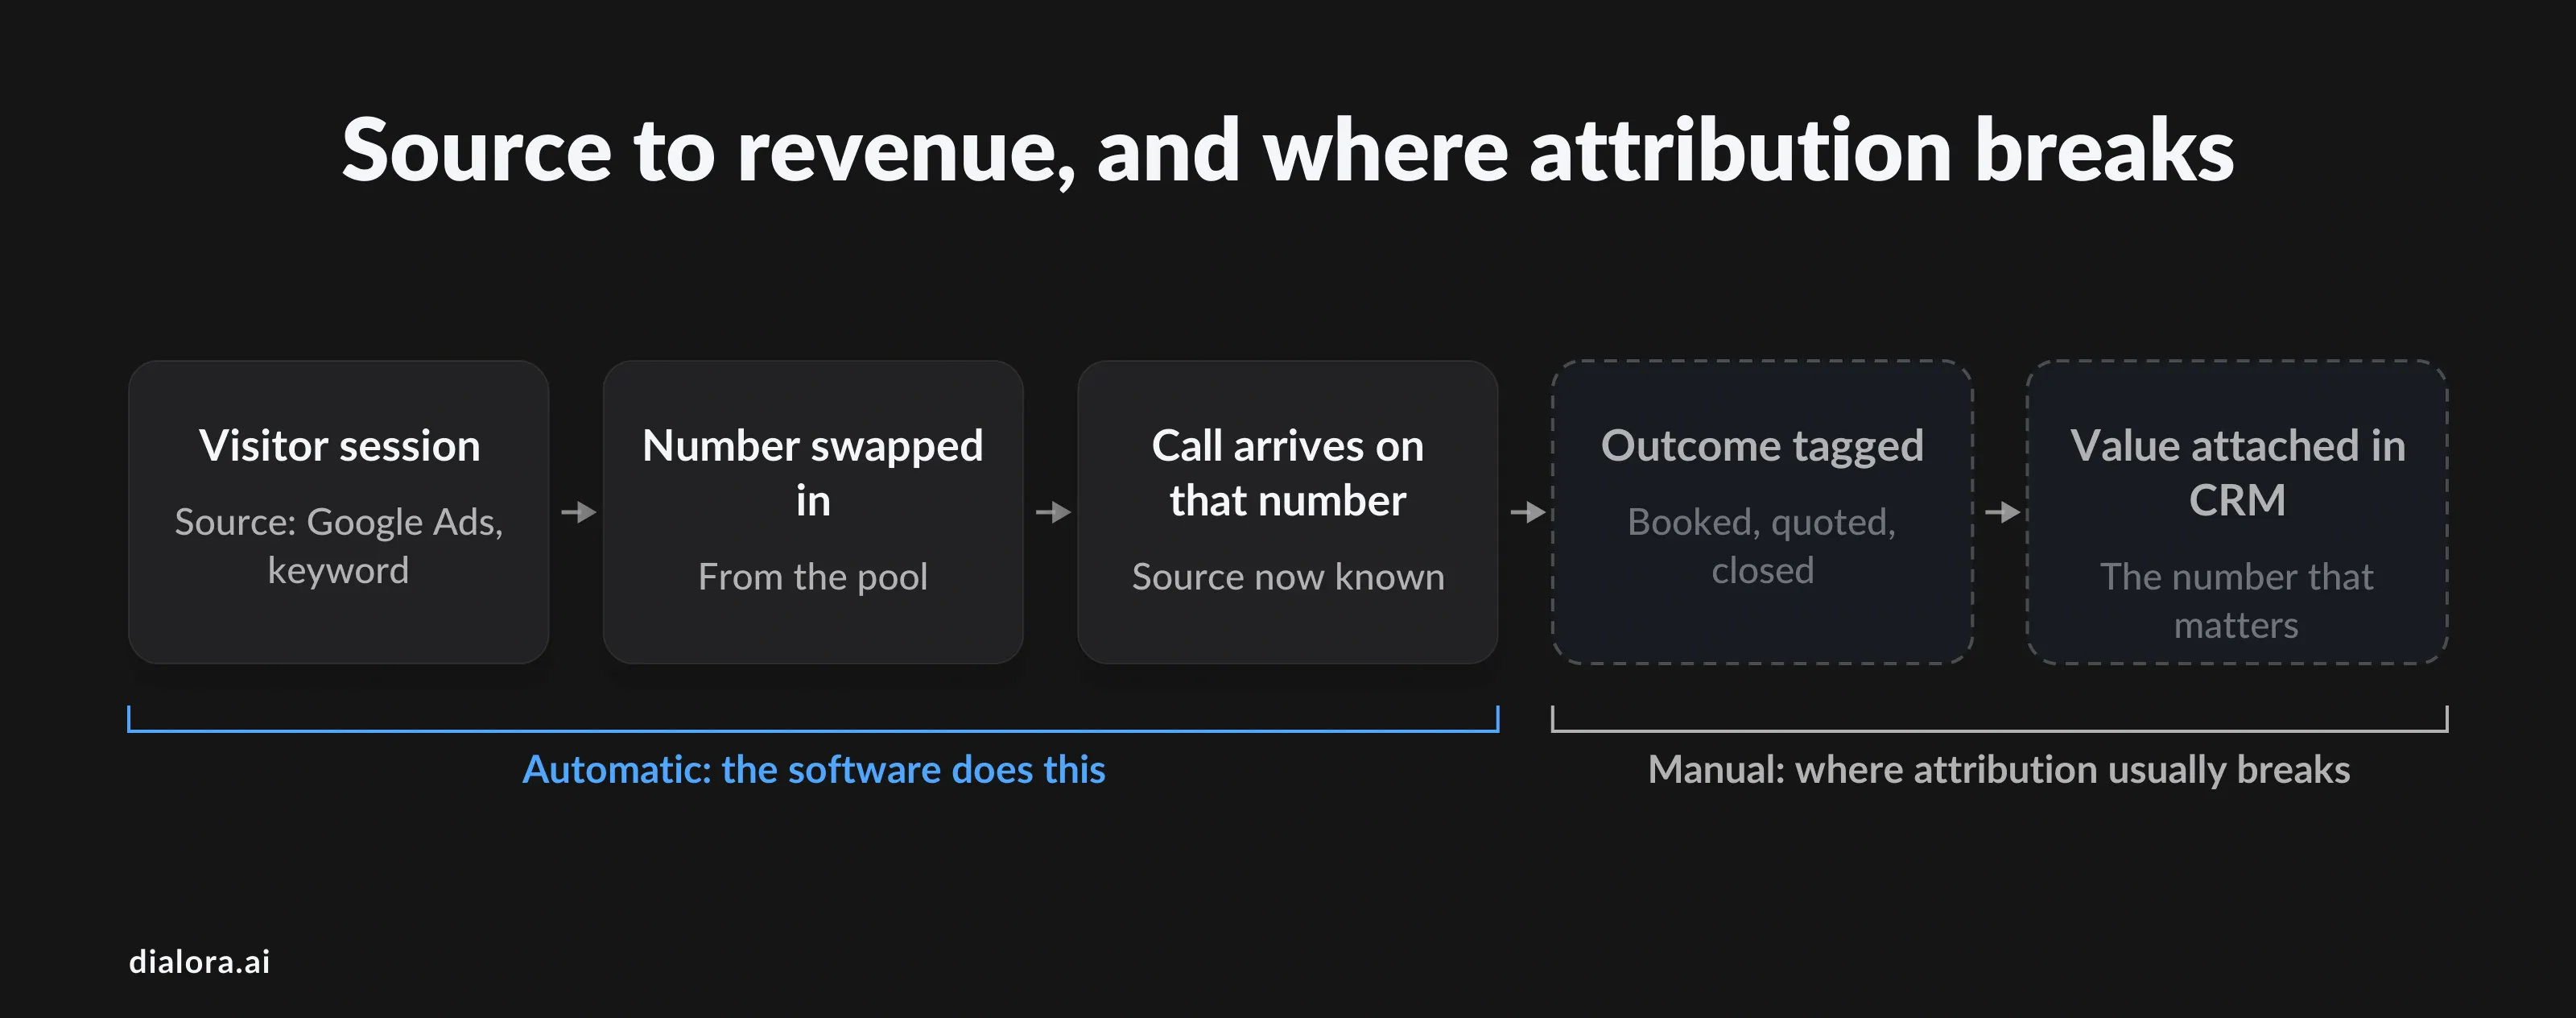
Three honest caveats. Number pools run out on busy sites and calls get attributed to the wrong session. Callers who see an ad and later Google your name and last-click credit to brand search. And attribution windows are a choice; a call thirty days after the click is still that click's call if you say so. Publish the rules once, then stop arguing about them.
What changes when an AI agent answers the phone?
The first five metrics stop being interesting, and the next ten become measurable for the first time.
When an AI voice agent picks up every call at any hour, the answer rate goes to roughly 100% and abandonment collapses, so the availability numbers become a floor rather than a report. The questions that matter move down the list: what share of intentions did the agent resolve without a person, how cleanly did it hand over the rest, and did the transcript and collected details arrive with the transfer.
Every call is also transcribed by default, so metrics 9, 11 and 15 stop depending on what an agent typed. Reason codes, outcomes and sentiment come from the conversation itself, which is the part of inbound call center analytics most human teams never had time to build.
At Dialora we report containment by intent rather than as one blended figure, because a 70% rate on order status and a 20% rate on complaints average to a number that describes nobody. The blended industry median sits near 41% and vendor decks quote higher; our statistics guide walks through why. The honest read of an AI answering layer is the answer rate it fixes and the callback queue it empties, more than any deflection percentage.
How do you build a call center reporting dashboard people actually read?
One page, four questions, reviewed weekly. Most call center reporting fails from abundance rather than scarcity, and call metrics tracking works when the page is short enough to argue about.
- Lead with the calls you did not answer. Answer rate, after-hours share and speed to callback at the top, where the flattering numbers usually sit.
- Report by queue and by hour, never by global average. A 95% service level across the day can hide a 60% hour.
- Write each formula down once. Half of all metric arguments are two people using different denominators for abandonment.
- Standardise wrap-up codes, or let the transcript do it. Reason codes typed by agents drift within a month; codes derived from voice analytics do not.
- Alert on the exceptions. A missed call after 6pm, a voicemail unreturned for an hour, a call over 15 minutes. Dashboards get read weekly. Alerts get read now.
Conclusion
The dental group's numbers were real. So was the 31% at lunchtime. Both can be true because most inbound call analytics begin the moment a person picks up, and the calls that cost the most are decided before that.
Track the fifteen, but start with the five that count what you never answered, put a revenue figure next to them, and read the rest as the story of what happened once someone did. The best call tracking software and the best call center reporting dashboard are the ones that put the missed call at the top of the page.
Dialora builds AI voice agents that answer every inbound call, transcribe and tag each one, and hand the rest to your team with full context attached. The numbers above are measured on the entire call volume, not just the calls a person reached. Start a 7-day free trial and if your lunchtime looks like that dental group’s, we would rather show you the report on your own line than describe it.
Frequently asked questions
What is inbound call analytics?
The measurement of inbound calls, the ones customers initiate, from the ring to the outcome. It spans call tracking (where the call came from), call center analytics (wait time, handle time, resolution) and voice analytics (what was said, why they called, how they felt). Most teams run one of the three and miss what the other two would show.
How do analytics attribute revenue to inbound phone calls?
Through call tracking numbers tied to a source, joined to an outcome in the CRM. Dynamic number insertion shows each website visitor a number linked to their session, campaign or keyword; static numbers cover offline sources. When the call comes in, the source is recorded. Revenue attaches when someone tags the outcome and value on the call record, so attribution is only as complete as that tagging.
What are the most important inbound call metrics?
Answer rate measured at the trunk, first call resolution measured by survey, abandonment rate, speed to callback, and conversion rate per call split by source. Add after-hours share and revenue per call and you can price a missed call, which is the number that gets budget approved.
What is a good first call resolution rate and abandonment rate?
SQM Group's benchmarks: FCR averages 70% across industries, 70 to 79% is good and 80% or higher is world class, reached by about 5% of centres. Abandonment has an industry standard of 6%, with under 5% considered good. Both vary with call complexity, so compare within your sector.
What is the difference between call tracking and call center analytics?
Call tracking is marketing measurement: which campaign, keyword or listing produced a call, usually via tracking numbers. Call center analytics is operations measurement: queues, wait times, handle times, transfers and resolution once the call arrives. A complete call tracking system feeds one into the other so a source can be judged by its outcome.
How do I choose the best call tracking software?
Check that it attributes at session and keyword level, pushes calls into your CRM as records rather than notes, sizes number pools for your traffic, and includes transcripts and outcome tagging rather than selling them as add-ons. Then confirm it reports calls that were never answered, the metric most tools quietly leave out.